
前言
Echarts 是百度開源的一款數據可視化 JS 工具,數據可視化類型十分豐富,但是得通過導入 js 庫在 JAVA Web 項目上運行。
作為工作中常用 Python/ target=_blank class=infotextkey>Python 的選手,不能不知道這款數據可視化插件的強大。那么,能否在 Python 中也能用到 Echarts 的功能呢?尋找中驚喜地發現了 pyecharts,只需在python中安裝該模塊即可使用。
安裝
常用的pip安裝包一鍵安裝pyecharts
# pyecharts安裝命令:
python -m pip install pyecharts
Python + pyecharts具體應用
結合工作中的項目數據,我選擇了 test 項目需求中 hotel_code_new 為 CNSZVS_002,CWSWS_003 對應2019年12個月指標為 RNs 的數據做可視化展示與分析。
1.Hive數據庫查詢sql
hive_sql內容如下
# sql中所使用的部分語法為hive sql中常規的語法,與MySQL有所不同,請注意。
select rrrd1.hotel_code_new as hotel_code_new
      ,dda.natural_date as natural_date
      ,nvl(rrrd.room_nights, 0) as room_nights
 from ( select distinct substr(natural_dt,1,7) as natural_date
    from dws.dws_test_date_calendar
    where dt_year='2019'
        )dda
        left join
         (select 'CNSZVS_002' hotel_code_new
            UNION all select  'CWSWS_003' hotel_code_new
      )rrrd1
        left join
         (select  hotel_code_new
                    ,substr(stay_date,1,7) as stay_date
                    ,sum(number_of_room_nights) as room_nights
                from dwm.dwm_test_resvs_rom_daily_df
                where dt='2021-10-24'
                and hotel_code_new in(CNSZVS_002', 'CWSWS_003')
                    and resv_status in('CHECKEDSSSIN','CHECKEDSSSOUT')
                    and substr(stay_date,0,4) = '2019'
                    group by hotel_code_new,substr(stay_date,1,7)
        )rrrd
        on dda.natural_date = rrrd.stay_date
        and rrrd1.hotel_code_new=rrrd.hotel_code_new
        order by rrrd.hotel_code_new;
2.Python代碼實現—柱狀圖
from impala.dbapi import connect
import warnings

#數據倉庫數據獲取準備
def hive_connect(sql):
    warnings.filterwarnings('ignore')
    config_hive_beta = {
        'host': '10.7.0.12',  #hive的host地址
        'port': 10000,    #hive的端口號
        'user': 'hive',    #hive的username
        'password': 'hive',    #hive的password
        'database': 'tmp',     #hive中需要查詢的數據庫名
        'auth_mechanism': 'PLAIN' #hive的hive-site.xml配置文件中獲取
    }
    conn = connect(**config_hive_beta)
    cursor = conn.cursor()
    cursor.execute(sql)
    hive_all_data = cursor.fetchall()
    return hive_all_data


# all_data = hive_connect(hive_sql)
# 通過調用hive_connect方法獲取到的數據庫查詢結果數據如all_data列表所示
all_data = [('CNSZVS_002', '2019-01', 0), ('CNSZVS_002', '2019-02', 0), ('CNSZVS_002', '2019-03', 0),
            ('CNSZVS_002', '2019-04', 0), ('CNSZVS_002', '2019-05', 0), ('CNSZVS_002', '2019-06', 2353),
            ('CNSZVS_002', '2019-07', 2939), ('CNSZVS_002', '2019-08', 5148), ('CNSZVS_002', '2019-09', 3850),
            ('CNSZVS_002', '2019-10', 4973), ('CNSZVS_002', '2019-11', 5467), ('CNSZVS_002', '2019-12', 4742),
            ('CWSWS_003', '2019-01', 5914), ('CWSWS_003', '2019-02', 4434), ('CWSWS_003', '2019-03', 6003),
            ('CWSWS_003', '2019-04', 6611), ('CWSWS_003', '2019-05', 6586), ('CWSWS_003', '2019-06', 5840),
            ('CWSWS_003', '2019-07', 6624), ('CWSWS_003', '2019-08', 7001), ('CWSWS_003', '2019-09', 5792),
            ('CWSWS_003', '2019-10', 6898), ('CWSWS_003', '2019-11', 6944), ('CWSWS_003', '2019-12', 5404)]

# 從pyecharts模塊導入柱狀圖-Bar
from pyecharts import Bar
# 設置橫軸行名,這里使用12個月份的英文簡稱
columns = ["Jan", "Feb", "Mar", "Apr", "May", "Jun", "Jul", "Aug", "Sep", "Oct", "Nov", "Dec"]
# 分別新建2個空list用于存儲每個月份對應的RNs的值
CNSZVS_002 = []
CWSWS_003 = []

for i in all_data:
    if i[0] == 'CNSZVS_002':
        CNSZVS_002.Append(i[2])
    elif i[0] == 'CWSWS_003':
        CWSWS_003.append(i[2])
    else:
        pass
# 設置柱狀圖的主標題與副標題
bar = Bar("柱狀圖", "Test需求—2019年的RNs")
# 添加柱狀圖的數據及配置項-求平均值、最大值、最小值
bar.add("CNSZVS_002", columns, CNSZVS_002, mark_line=["average"], mark_point=["max", "min"])
bar.add("CWSWS_003", columns, CWSWS_003, mark_line=["average"], mark_point=["max", "min"])
# 在本py文件同級目錄下生成名為render.html的本地文件(默認為.html文件)
bar.render()
# 也可設置成指定的路徑用于保存html文件
#bar.render(r"D:bar_render.html")
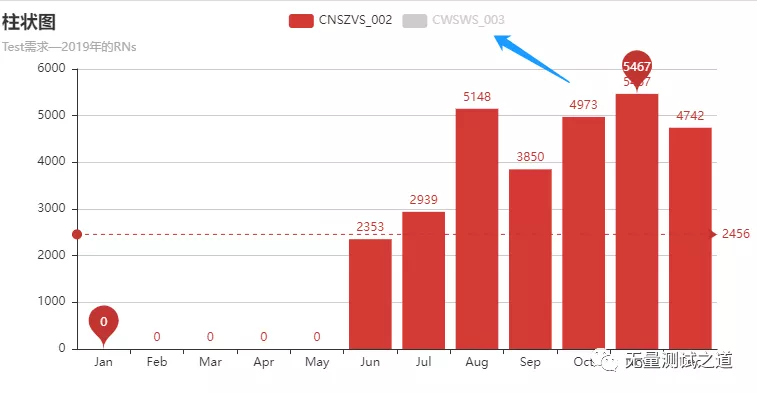
柱狀效果圖展示
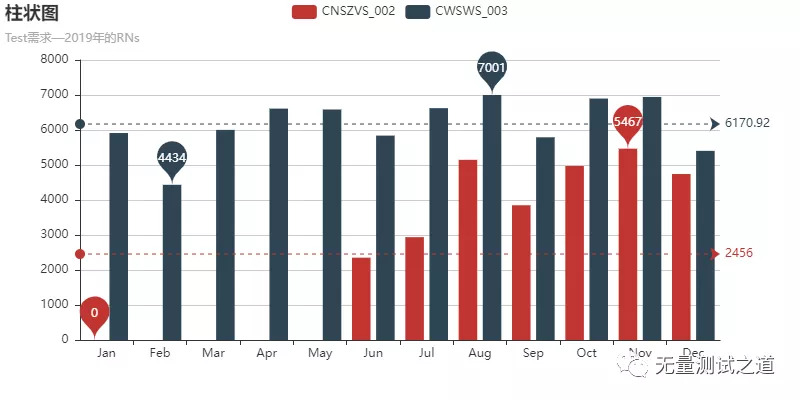
生成的柱狀效果圖是html格式的,可以在瀏覽器中打開查看,在瀏覽器中支持下載成圖片格式到本地,并且點擊圖例即可置灰對應的圖例,同時隱藏圖例對應的柱狀圖數據,如下圖所示。
3.Python代碼實現—餅狀圖
注意:數據準備部分的代碼與柱狀圖一樣,這里只展示餅狀圖特有的代碼
# 從pyecharts模塊中導入餅圖Pie
from pyecharts import Pie
# 設置主標題與副標題,標題設置居中,設置寬度為1000
pie = Pie("餅狀圖", "Test需求—2019年的RNs", title_pos='left', width=1000)
# 使用add導入數據,設置坐標位置為【20,50】,上方的colums選項取消顯示
pie.add("CNSZVS_002", columns, CNSZVS_002, center=[20, 50], is_legend_show=True)
# 使用add導入數據,設置坐標位置為【75,50】,上方的colums選項正常顯示
pie.add("CWSWS_003", columns, CWSWS_003, center=[75, 50], is_legend_show=False, is_label_show=True)
# 保存圖表
pie.render()
餅狀效果圖展示——隱藏所占百分比

餅狀效果圖展示——展示所占百分比

4.Python代碼實現—箱型圖
# 從pyecharts模塊導入箱型圖Boxplot
from pyecharts import Boxplot
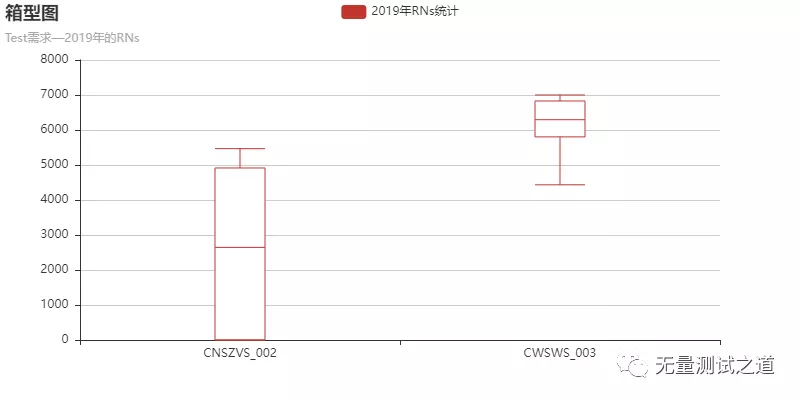
boxplot = Boxplot("箱型圖", "Test需求—2019年的RNs")
x_axis = ['CNSZVS_002', 'CWSWS_003']
y_axis = [CNSZVS_002, CWSWS_003]
# prepare_data方法可以將數據轉為嵌套的 [min, Q1, median (or Q2), Q3, max]
yaxis = boxplot.prepare_data(y_axis)
boxplot.add("2019年RNs統計", x_axis, yaxis)
boxplot.render()
箱型圖效果展示
5.Python代碼實現—折線圖
from pyecharts import Line
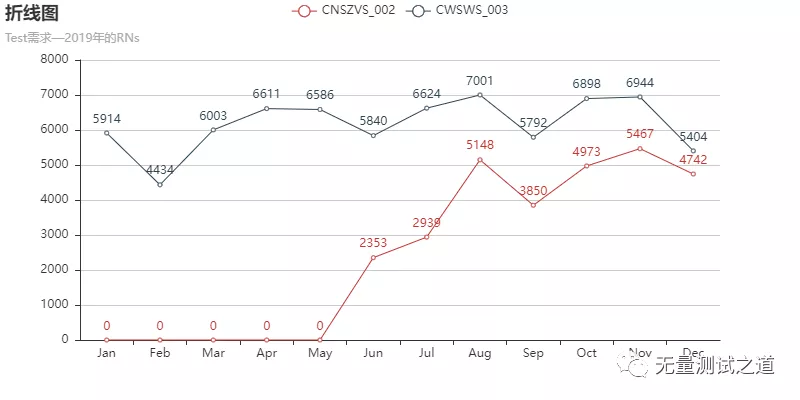
line = Line("折線圖", "Test需求—2019年的RNs")
# is_label_show屬性是設置上方數據是否顯示
line.add("CNSZVS_002", columns, CNSZVS_002, is_label_show=True)
line.add("CWSWS_003", columns, CWSWS_003, is_label_show=True)
line.render()
折線圖效果展示
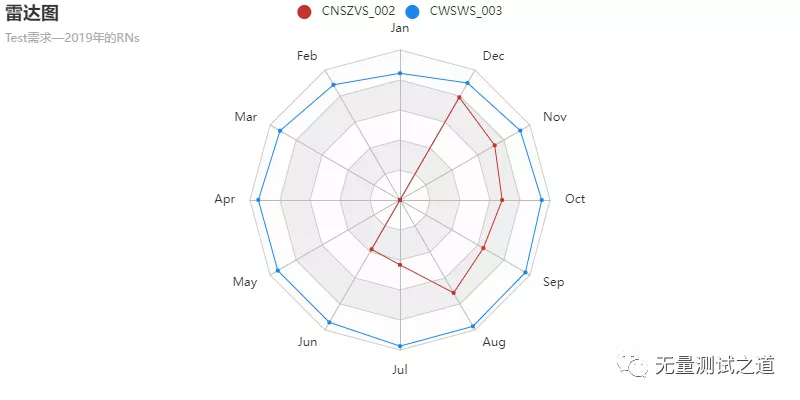
6.Python代碼實現—雷達圖
from pyecharts import Radar
radar = Radar("雷達圖", "Test需求—2019年的RNs")
# 由于雷達圖傳入的數據得為多維數據,需要將list再進行list轉換一次
CNSZVS_002 = [CNSZVS_002]
CWSWS_003 = [CWSWS_003]
# 設置column的最大值,為了雷達圖更為直觀,這里的月份最大值設置依據真實數據的值來設置,因此各個月份有所不同
schema_diff = [
    ("Jan", 7000), ("Feb", 5000), ("Mar", 6500),
    ("Apr", 7000), ("May", 7000), ("Jun", 6200),
    ("Jul", 6800), ("Aug", 7200), ("Sep", 6000),
    ("Oct", 7300), ("Nov", 7500), ("Dec", 6000)
]
# 傳入坐標
radar.config(schema_diff)
radar.add("CNSZVS_002", CNSZVS_002)
# 一般默認為同一種顏色,這里為了便于區分,需要設置item的顏色
radar.add("CWSWS_003", CWSWS_003, item_color="#1C86EE")
radar.render()
雷達效果圖展示
7.Python代碼實現—散點圖
from pyecharts import Scatter
scatter = Scatter("散點圖", "Test需求—2019年的RNs")
# xais_name是設置橫坐標名稱,這里由于顯示問題,還需要將y軸名稱與y軸的距離進行設置
scatter.add("CWSWS_003&CNSZVS_002 RNs的散點分布", CNSZVS_002, CWSWS_003, xaxis_name="CNSZVS_002", yaxis_name="CWSWS_003", yaxis_name_gap=40)
scatter.render()
散點圖效果展示
總結
- 準備符合要求的數據及其格式
- 導入對應圖表所使用的包
- add()方法:主要方法,用于添加圖表的數據和設置各種配置項
- render()方法:用于保存生成的圖表


